Step by step

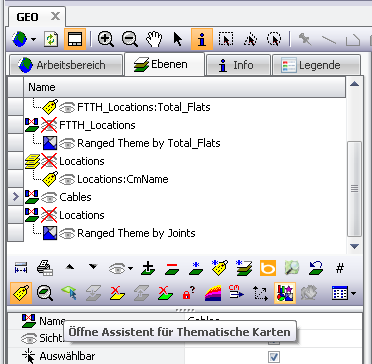
Launch |
Start directly with the "Assistant for Thematic Maps"".
|
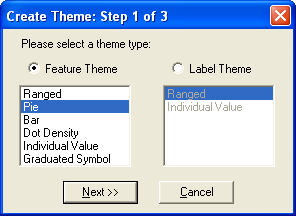
Select type |
Select "Pie" and click Next
|
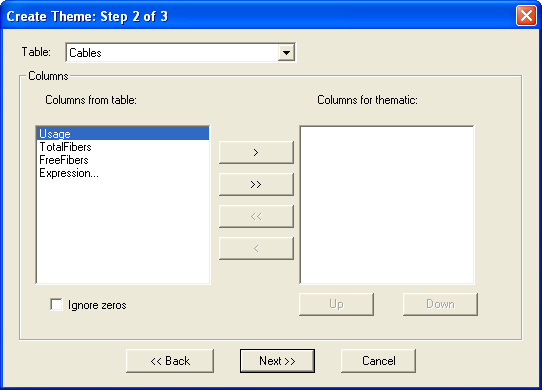
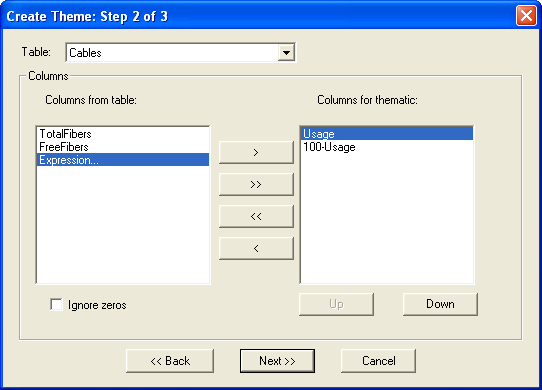
Layer & Data Fields |
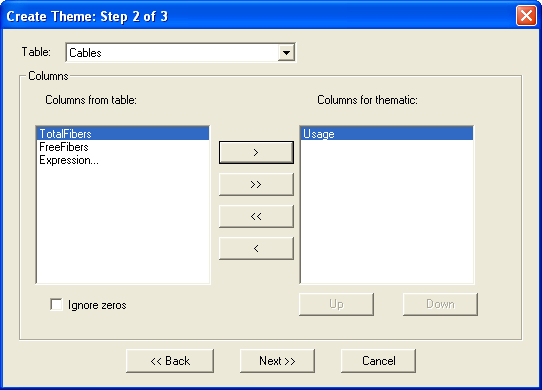
Select the layer "Cables" and add the data field "Usage". Note: Only number fields are offered!
|
|
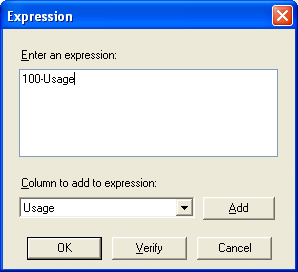
Now click on Expression to define a formula.
|
Formula |
Define a formula for the difference between the load and 100.
Click OK
|
|
Click Next. |
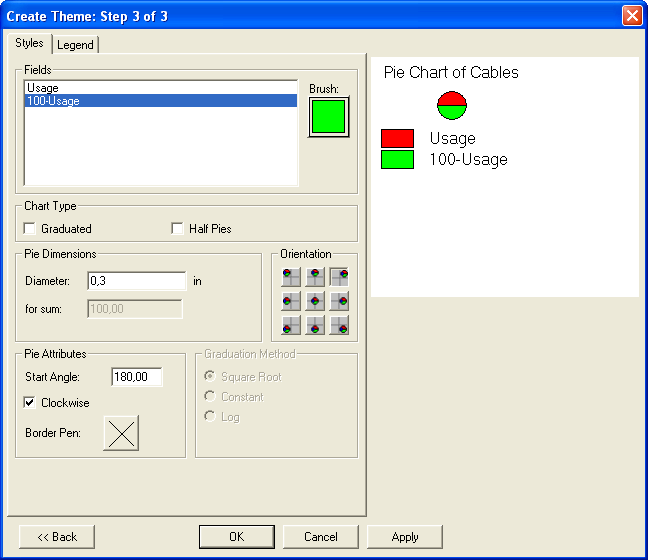
Define styles |
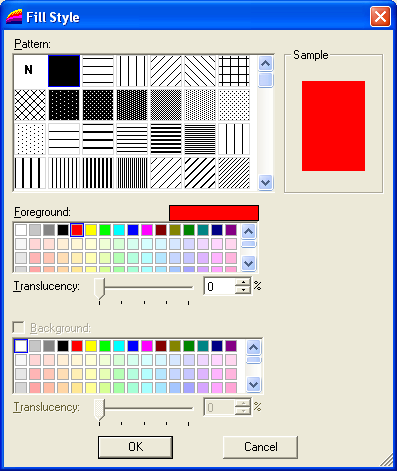
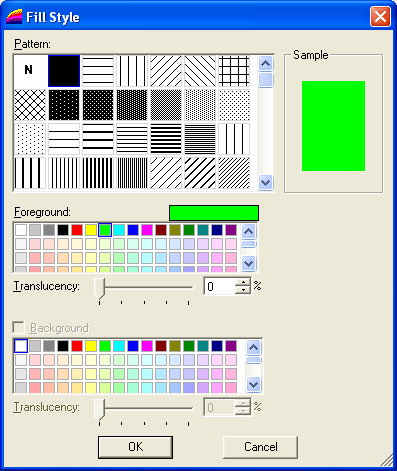
Remove the "Graduated" check mark. All cake digrams are displayed with the same size. Now define a color for each piece of cake.
|
Value Usage |
|
Value 100-Usage |
|
Size of the pie chart |
|
Position of the pie chart |
|
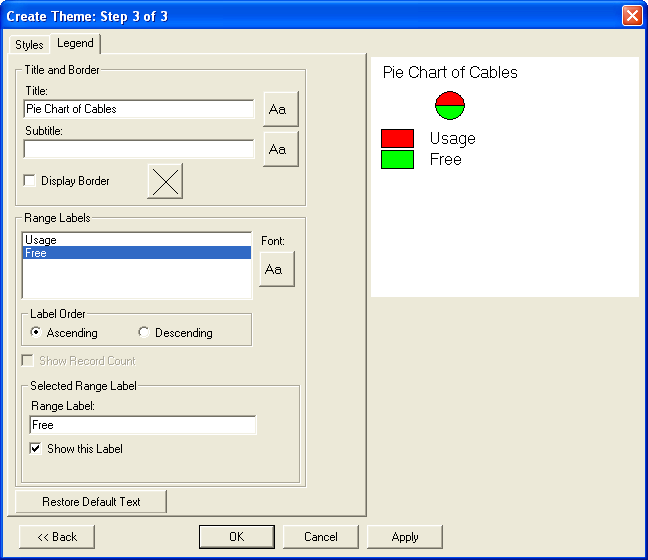
Label |
Switch to the "Legend" tab.
|