GIS pane

The GIS pane is where your data is visualized on top of a map. ConnectMaster online uses OpenStreetMap as the background map and can display your ConnectMaster GIS layers on top if they are available through a WMS server.
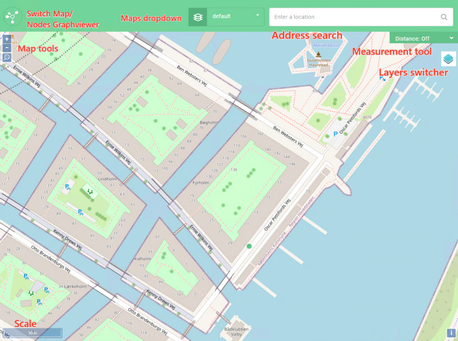
The map has 4 types of markers.
|
Blue dot |
Display your current position if your device has GPS enabled. The map will default jump to that position after login. |
|
Green dot |
Display a found address |
|
Red circle |
Highlight a point which refers to the entity you are have opened in the detail pane. |
|
Purple dot with a number inside it |
Highlight events, when in the event list. The number is the number of events in that location. |
When highlighting polylines, the whole polyline will change color. Default is red, but the color can be configured on the server.
When the measuring distance between objects, a black dotted line will show the measured path.
The map has 3 action buttons.
|
Zoom in |
|
Zoom out |
|
Zoom to extent |