Location Graph view

Location Graph view is accessed when user switches to showing Location Graph instead of Map viewer and selects a Location to show its details.
It is an alternative implementation of the presentation of GIS on the map view.
It is destined for use if GIS data are not available and represents locations connected by cables.
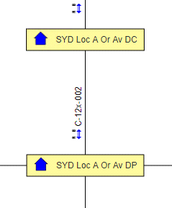
Square nodes represent the Locations, the connections represent the components (cables).
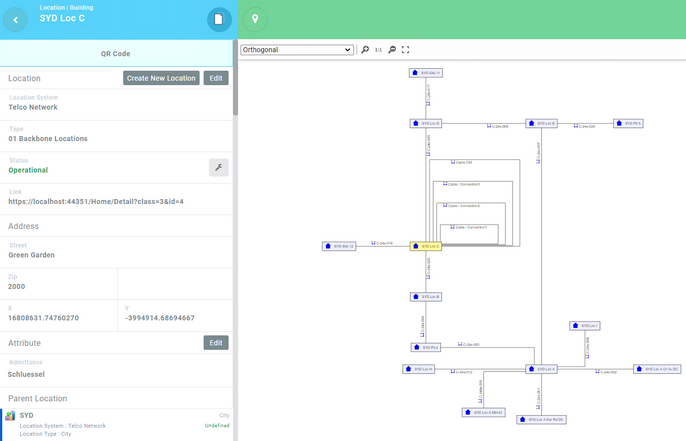
Graph view – Example on selected location.
The graph viewer’s header contains the following controllers:
-Zoom-in
-Zoom-out
-Zoom to Original Size
-Fit Content Button
-Dropdown to change the layout algorithm
The Orthogonal layout algorithm is applied by default to the graph.
Note: The Graph view will show nodes graph only when a location or a component is selected from the list. If an entity has no connections, a message will be shown indicating that there are no connections available for the selected entity. |
The Location Graph viewer is clickable; user can access locations details and components details with a click on the item available within the graph viewer.
The selected location is highlighted in the graph and zoomed in.
Once a cable is clicked, the connected locations connected through it are highlighted in the graph.