Project Schedule
Project Plan Tab |
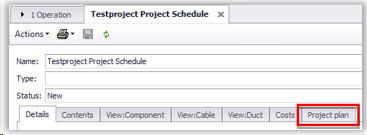
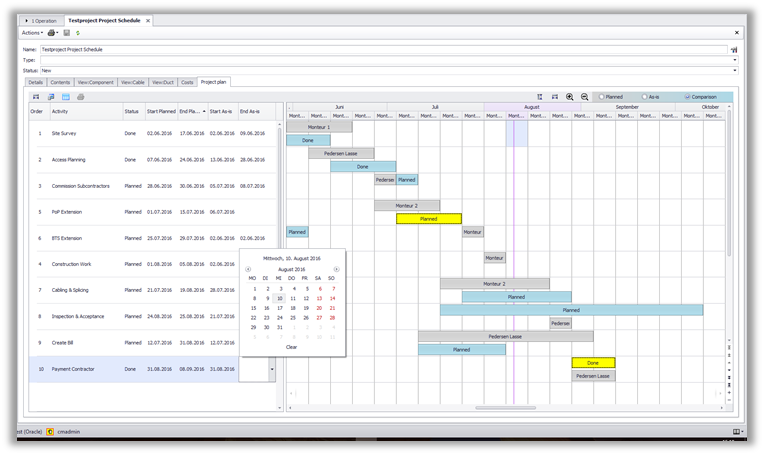
In the Tab ‘Project plan’ a Gannt diagram of the project is shown.
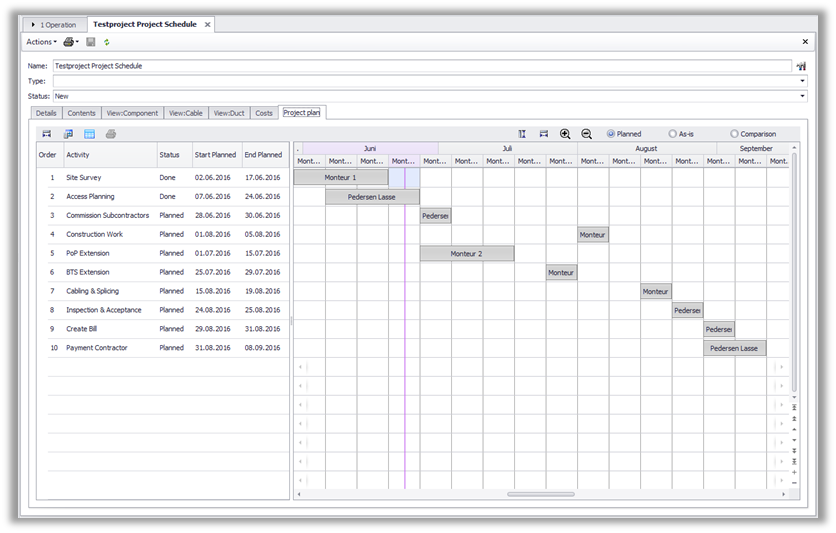
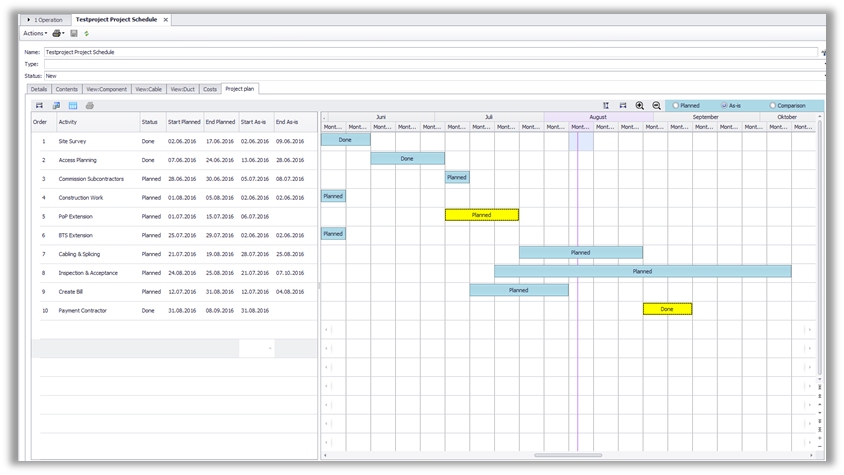
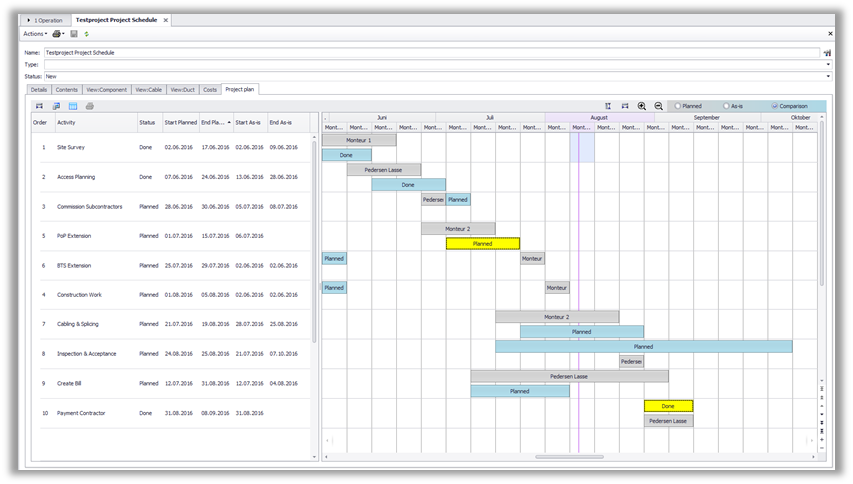
Per default the diagram starts with a view on the ‘Planned’ dates. By use of the controls on the top right this can be switched to the As-is View and a Control-View to compare the Planned and As-is time bars.
|
||||||||
Plan View
|
In the ‘Plan View’ the ‘Planned’-dates are shown as time bars. The time bars contain as default (not configurable) the information of the field ‘Responsible’.
|
||||||||
As-is View
|
The As-is view shows the ‘As-is’ dates of the activities. The time bars contain as default (not configurable) the information of the ‘Status’ field.
|
||||||||
Control View |
The Control-View compares the Planned- and As-is dates in one view with different colours of the time bars.
•Status •Start-/End-Dates
|
||||||||
Display Configuration |
The Project plan display can be adjusted by the User by use of the control buttons
|
||||||||
Report |
(The possibility to create a report of the Project Plan is planned for an upcoming release)
|

